10 total points
Due: Feburary 2nd, 2026 at 11:59 p.m.
Directions:
Please rename the file by clicking on “LX-First-Last.ipynb” where X is the lab number, and replace First and Last with your first and last name.
Click File -> Save to make sure your most recent edits are saved.
In the upper right hand corner of the screen, click on “Share”. Click on “Restricted” and change it to “Anyone with the link”.
Copy the link and submit it on Blackboard. Make sure you follow these steps completely, or I will be unable to grade your work.
Overview
This lab will help you understand Cartopy and its capabilities. We will walk through some examples of how cartopy can help solve Geoscience problems. Periodically, I will 1) ask you to either repeat the demonstrated code in a slightly different way; or 2) ask you to combine two or more techniques to solve a problem.
Please do not use generative AI to answer these problems. In one example, I provide generative AI code that “solves” a problem and ask you to tell me where it went wrong. It is crucial that you understand the code well enough to effectively use generative AI tools that are likely to be widely available and recommended for use at many organizations. Although they are improving at an incredible rate, they still produce bugs, especially with domain-specific and complex problems.
Download
Make sure that you run the following commands to download the data used for this lab. This dataset includes all hail reports from 2024:
!mkdir hail_data
!cd hail_data && wget -nc https://www.spc.noaa.gov/wcm/data/2024_hail.csv
mkdir: cannot create directory ‘hail_data’: File exists
File ‘2024_hail.csv’ already there; not retrieving.
The hail data used in this lab has the following data structure:
import pandas as pd

df = pd.read_csv("hail_data/2024_hail.csv")

dfThe columns provided in these data include the fields below and are described in this document: https://
import pandas as pd

df = pd.read_csv("hail_data/2024_hail.csv")

df.columns
Index(['om', 'yr', 'mo', 'dy', 'date', 'time', 'tz', 'st', 'stf', 'stn', 'mag',
'inj', 'fat', 'loss', 'closs', 'slat', 'slon', 'elat', 'elon', 'len',
'wid', 'ns', 'sn', 'sg', 'f1', 'f2', 'f3', 'f4'],
dtype='object')Install the required packages:
!pip install cartopyRequirement already satisfied: cartopy in /usr/local/lib/python3.12/dist-packages (0.25.0)
Requirement already satisfied: numpy>=1.23 in /usr/local/lib/python3.12/dist-packages (from cartopy) (2.0.2)
Requirement already satisfied: matplotlib>=3.6 in /usr/local/lib/python3.12/dist-packages (from cartopy) (3.10.0)
Requirement already satisfied: shapely>=2.0 in /usr/local/lib/python3.12/dist-packages (from cartopy) (2.1.2)
Requirement already satisfied: packaging>=21 in /usr/local/lib/python3.12/dist-packages (from cartopy) (25.0)
Requirement already satisfied: pyshp>=2.3 in /usr/local/lib/python3.12/dist-packages (from cartopy) (3.0.3)
Requirement already satisfied: pyproj>=3.3.1 in /usr/local/lib/python3.12/dist-packages (from cartopy) (3.7.2)
Requirement already satisfied: contourpy>=1.0.1 in /usr/local/lib/python3.12/dist-packages (from matplotlib>=3.6->cartopy) (1.3.3)
Requirement already satisfied: cycler>=0.10 in /usr/local/lib/python3.12/dist-packages (from matplotlib>=3.6->cartopy) (0.12.1)
Requirement already satisfied: fonttools>=4.22.0 in /usr/local/lib/python3.12/dist-packages (from matplotlib>=3.6->cartopy) (4.61.1)
Requirement already satisfied: kiwisolver>=1.3.1 in /usr/local/lib/python3.12/dist-packages (from matplotlib>=3.6->cartopy) (1.4.9)
Requirement already satisfied: pillow>=8 in /usr/local/lib/python3.12/dist-packages (from matplotlib>=3.6->cartopy) (11.3.0)
Requirement already satisfied: pyparsing>=2.3.1 in /usr/local/lib/python3.12/dist-packages (from matplotlib>=3.6->cartopy) (3.3.1)
Requirement already satisfied: python-dateutil>=2.7 in /usr/local/lib/python3.12/dist-packages (from matplotlib>=3.6->cartopy) (2.9.0.post0)
Requirement already satisfied: certifi in /usr/local/lib/python3.12/dist-packages (from pyproj>=3.3.1->cartopy) (2026.1.4)
Requirement already satisfied: six>=1.5 in /usr/local/lib/python3.12/dist-packages (from python-dateutil>=2.7->matplotlib>=3.6->cartopy) (1.17.0)
Introduction
We can very quickly plot maps using Cartopy. A very basic world map can be created using the following code:
import matplotlib.pyplot as plt
import cartopy.crs as ccrs
import cartopy.feature as cfeature

plt.rcParams['figure.figsize'] = 15, 8

ax = plt.subplot(1, 1, 1, projection=ccrs.PlateCarree())

ax.add_feature(cfeature.BORDERS)
ax.add_feature(cfeature.COASTLINE)
<cartopy.mpl.feature_artist.FeatureArtist at 0x79e100b034a0>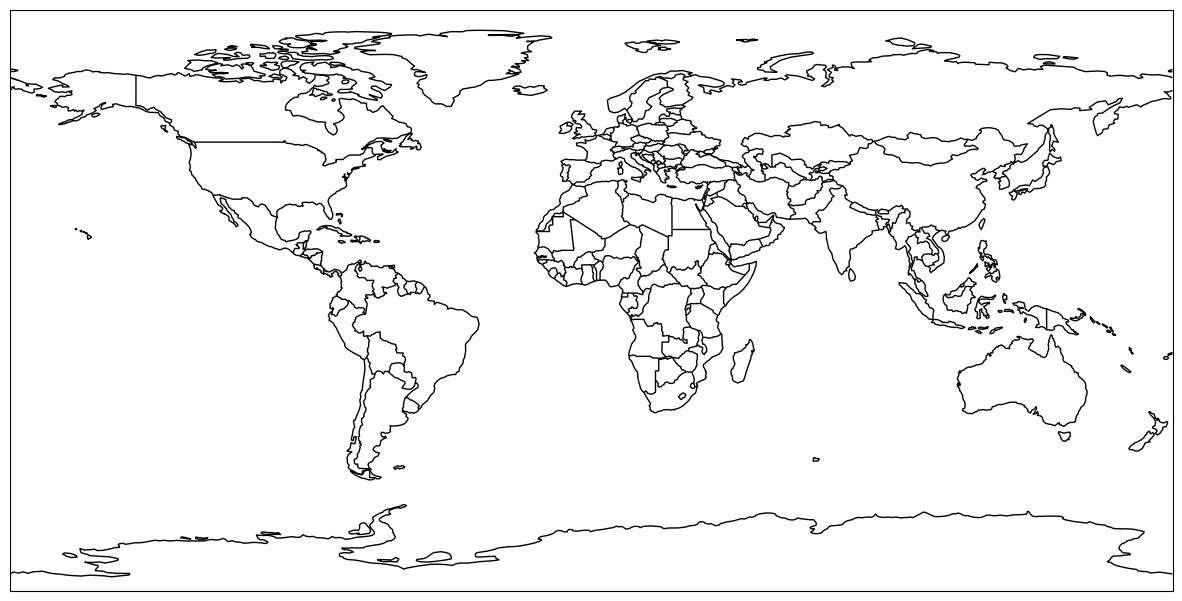
Problem 1
2 points
Using what we learned from Chapter 7.2, use four different global projections in a 2 by 2 subplot group by changing the template below. Add a title to each subplot that communicates the name of the projection.
Do not use the default projection settings below as one of your projections and do not use the same “name” with 4 different projection parameters.
You can find a list of projections here: https://
ax00 = plt.subplot(2, 2, 1, projection=ccrs.PlateCarree())

ax00.add_feature(cfeature.BORDERS)
ax00.add_feature(cfeature.COASTLINE)

ax01 = plt.subplot(2, 2, 2, projection=ccrs.PlateCarree())

ax01.add_feature(cfeature.BORDERS)
ax01.add_feature(cfeature.COASTLINE)

ax11 = plt.subplot(2, 2, 3, projection=ccrs.PlateCarree())

ax11.add_feature(cfeature.BORDERS)
ax11.add_feature(cfeature.COASTLINE)

ax12 = plt.subplot(2, 2, 4, projection=ccrs.PlateCarree())

ax12.add_feature(cfeature.BORDERS)
ax12.add_feature(cfeature.COASTLINE)
<cartopy.mpl.feature_artist.FeatureArtist at 0x79e1009c7800>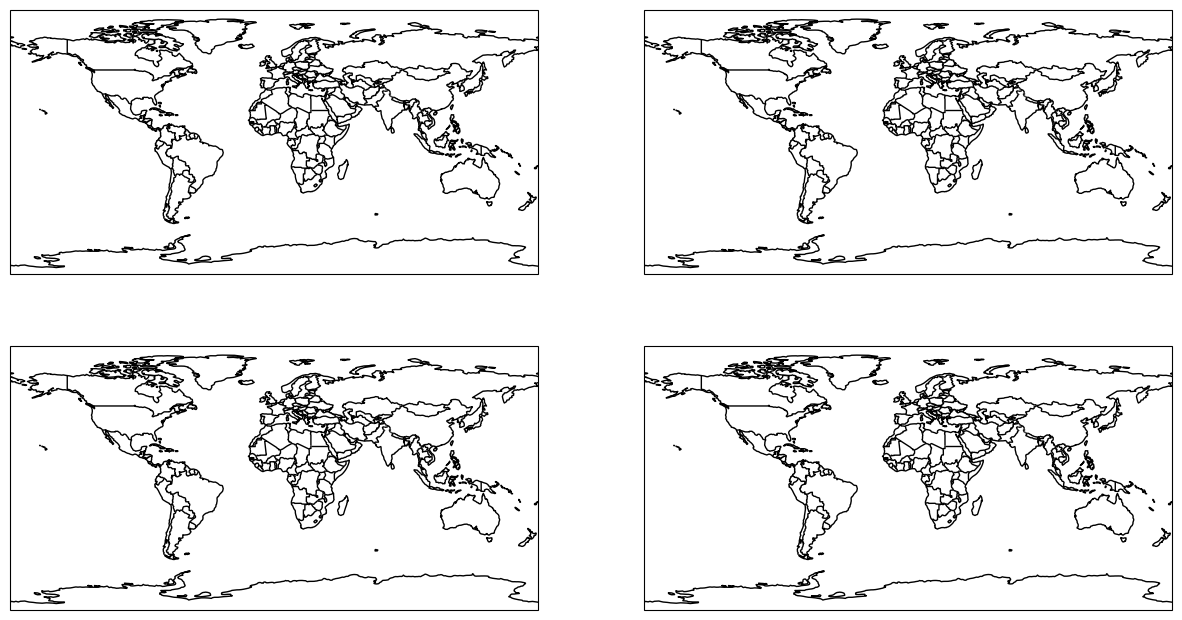
Problem 2
2 points
Using what we learned from Chapter 7.2, use four different regional projections in a 2 by 2 subplot group by changing the template below. Add a title to each subplot that communicates the name of the projection. Add US states to your map, and zoom in to a region that only shows the lower-48 US states, southern Canada, and northern Mexico.
Do not use the default projection settings below as one of your projections and do not use the same “name” with 4 different projection parameters.
You can find a list of projections here: https://
ax00 = plt.subplot(2, 2, 1, projection=ccrs.PlateCarree())

ax00.add_feature(cfeature.BORDERS)
ax00.add_feature(cfeature.COASTLINE)

ax01 = plt.subplot(2, 2, 2, projection=ccrs.PlateCarree())

ax01.add_feature(cfeature.BORDERS)
ax01.add_feature(cfeature.COASTLINE)

ax11 = plt.subplot(2, 2, 3, projection=ccrs.PlateCarree())

ax11.add_feature(cfeature.BORDERS)
ax11.add_feature(cfeature.COASTLINE)

ax12 = plt.subplot(2, 2, 4, projection=ccrs.PlateCarree())

ax12.add_feature(cfeature.BORDERS)
ax12.add_feature(cfeature.COASTLINE)
<cartopy.mpl.feature_artist.FeatureArtist at 0x79e100a2b0b0>Problem 3
4 points
The code below reads in the hail data that was downloaded earlier, and plots the reports using the slat and slon columns on a map.
However, none of the country borders or other geographic information show up!
Problem 3a
In this markdown, explain what happened.
Problem 3b
“Comment out” the line that caused the issue, and fix that line with code that correctly plots the hail data.
Add a title to the plot that says “2024 Hail Reports”
Add US States to the map
import pandas as pd

df = pd.read_csv("hail_data/2024_hail.csv")

ax = plt.subplot(2, 2, 1, projection=ccrs.LambertConformal())

ax.add_feature(cfeature.BORDERS)
ax.add_feature(cfeature.COASTLINE)

ax.plot(df.slon, df.slat, 'b.', markersize=0.5)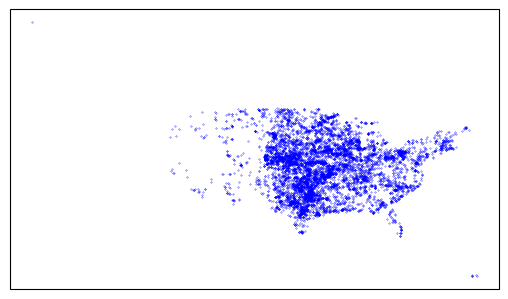
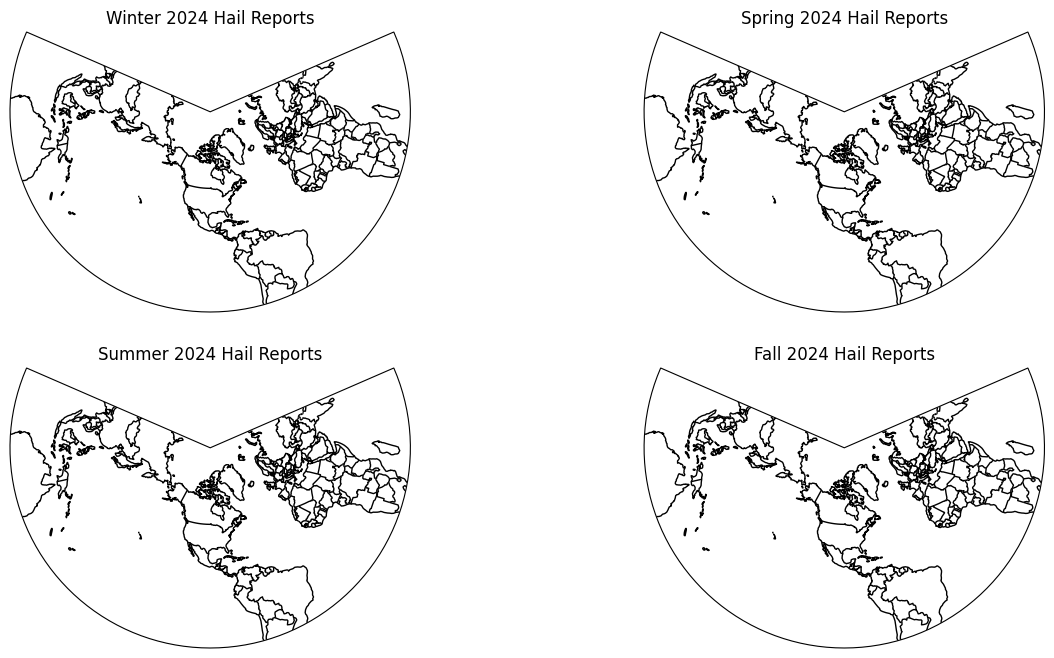
Problem 4
4 points
Create a set of seasonal subplots that display the hail reports only for that season. In Climate/Meteorology, seasons are defined as:
Winter (DJF): the entire months of December, January and February (413 rows)
Spring (MAM): the entire months of March, April, and May (5354 rows)
Summer (JJA): the entire months of June, July, and August (2759 rows)
Fall (SON): the entire months of September, October, and November (355 rows)
Problem 4a.
Create a subset of pandas data for each season by adding pandas filters to the code below based on the definitions above.
Problem 4b.
Add US states to your map, and zoom in to a region that only shows the lower-48 US states, southern Canada, and northern Mexico. Plot the data from the correct subset based on the subplot titles below.
hail = pd.read_csv("hail_data/2024_hail.csv")

# Add filters
winter = hail
spring = hail
summer = hail
fall = hail

ax00 = plt.subplot(2, 2, 1, projection=ccrs.LambertConformal())
ax00.set_title("Winter 2024 Hail Reports")

ax00.add_feature(cfeature.BORDERS)
ax00.add_feature(cfeature.COASTLINE)

ax01 = plt.subplot(2, 2, 2, projection=ccrs.LambertConformal())
ax01.set_title("Spring 2024 Hail Reports")

ax01.add_feature(cfeature.BORDERS)
ax01.add_feature(cfeature.COASTLINE)

ax11 = plt.subplot(2, 2, 3, projection=ccrs.LambertConformal())
ax11.set_title("Summer 2024 Hail Reports")

ax11.add_feature(cfeature.BORDERS)
ax11.add_feature(cfeature.COASTLINE)

ax12 = plt.subplot(2, 2, 4, projection=ccrs.LambertConformal())
ax12.set_title("Fall 2024 Hail Reports")

ax12.add_feature(cfeature.BORDERS)
ax12.add_feature(cfeature.COASTLINE)
<cartopy.mpl.feature_artist.FeatureArtist at 0x79e100816510>