Pandas groupby can make it easy to perform statistics on relevant groupings of data.
The groupby feature combines filtering, looping, and running statistics into one line. Your main job is to make sure you are using it correctly and to test it is working as you would expect.
Download the dataset
!wget -nc "https://raw.githubusercontent.com/ahaberlie/python_programming_geosciences/refs/heads/main/data/1950-2024_actual_tornadoes.csv"File ‘1950-2024_actual_tornadoes.csv’ already there; not retrieving.
Chapter 6.3.1 - Grouping data in the SPC dataset
If we wanted to get statistics for each year, we might be tempted to use filtering:
import pandas as pd

tor = pd.read_csv("1950-2024_actual_tornadoes.csv")

# DO NOT DO THIS!
yr_1950 = tor[tor.yr==1950]
yr_1951 = tor[tor.yr==1951]

print("Count for 1950", len(yr_1950))
print("Count for 1951", len(yr_1951))
Count for 1950 201
Count for 1951 260
As you can imagine, if we try this on a dataset of 100s or 1000s of years, this will become overwhelmingly complicated.
Let’s examine a better way with some example data:
test_data = {'month': [1, 1, 1, 4, 5, 8, 8, 10], 'data_value': [18.1, 9.1, 0.5, 1.0, 5.4, 9.0, 10.4, 9.5]}

df = pd.DataFrame.from_dict(test_data)

dfIf we wanted to find the mean data_value for each month, we could try and filter the data:
df[df.month==1]and then find the mean
df[df.month==1]['data_value'].mean()np.float64(9.233333333333334)and then repeat this for each month
print("Month 1 mean is", df[df.month==1]['data_value'].mean())
print("Month 4 mean is", df[df.month==4]['data_value'].mean())
print("Month 5 mean is", df[df.month==5]['data_value'].mean())
print("Month 8 mean is", df[df.month==8]['data_value'].mean())
print("Month 10 mean is", df[df.month==10]['data_value'].mean())
Month 1 mean is 9.233333333333334
Month 4 mean is 1.0
Month 5 mean is 5.4
Month 8 mean is 9.7
Month 10 mean is 9.5
we could even turn this into a loop
for month_int in df['month'].unique():

    condition = df.month==month_int

    df_filter = df[condition]

    mean_result = df_filter['data_value'].mean()

    print(f"The mean for month {month_int} is {mean_result:.2f}")
The mean for month 1 is 9.23
The mean for month 4 is 1.00
The mean for month 5 is 5.40
The mean for month 8 is 9.70
The mean for month 10 is 9.50
groupby can do this all for you!
group_means = df.groupby('month').mean()

group_meansChapter 6.3.2 - groupby statistics
Consider a situation where you want to calculate statistics for sets of data that share the same value in a column.
You might (correctly) choose to use groupby for this, and loop through every year, for example, and print out the statistics. You would (correctly) use the ‘yr’ column in the groupby method. However, you might not know what to do next.
You might try to loop through the groupby results and print out all of your sum and mean statistics for the subset columns:
for group_id, group_data in tor.groupby('yr'):

    print("tornado fatalities in", group_id, "=", group_data['fat'].sum())

for group_id, group_data in tor.groupby('yr'):

    print("Average month in", group_id, group_data['mo'].mean())
tornado fatalities in 1950 = 70
tornado fatalities in 1951 = 34
tornado fatalities in 1952 = 230
tornado fatalities in 1953 = 523
tornado fatalities in 1954 = 36
tornado fatalities in 1955 = 129
tornado fatalities in 1956 = 81
tornado fatalities in 1957 = 192
tornado fatalities in 1958 = 67
tornado fatalities in 1959 = 58
tornado fatalities in 1960 = 46
tornado fatalities in 1961 = 52
tornado fatalities in 1962 = 30
tornado fatalities in 1963 = 31
tornado fatalities in 1964 = 73
tornado fatalities in 1965 = 301
tornado fatalities in 1966 = 98
tornado fatalities in 1967 = 114
tornado fatalities in 1968 = 131
tornado fatalities in 1969 = 66
tornado fatalities in 1970 = 73
tornado fatalities in 1971 = 159
tornado fatalities in 1972 = 27
tornado fatalities in 1973 = 89
tornado fatalities in 1974 = 366
tornado fatalities in 1975 = 60
tornado fatalities in 1976 = 44
tornado fatalities in 1977 = 43
tornado fatalities in 1978 = 53
tornado fatalities in 1979 = 84
tornado fatalities in 1980 = 28
tornado fatalities in 1981 = 24
tornado fatalities in 1982 = 64
tornado fatalities in 1983 = 34
tornado fatalities in 1984 = 122
tornado fatalities in 1985 = 94
tornado fatalities in 1986 = 15
tornado fatalities in 1987 = 59
tornado fatalities in 1988 = 32
tornado fatalities in 1989 = 50
tornado fatalities in 1990 = 53
tornado fatalities in 1991 = 39
tornado fatalities in 1992 = 39
tornado fatalities in 1993 = 33
tornado fatalities in 1994 = 69
tornado fatalities in 1995 = 30
tornado fatalities in 1996 = 26
tornado fatalities in 1997 = 68
tornado fatalities in 1998 = 130
tornado fatalities in 1999 = 94
tornado fatalities in 2000 = 41
tornado fatalities in 2001 = 40
tornado fatalities in 2002 = 55
tornado fatalities in 2003 = 54
tornado fatalities in 2004 = 35
tornado fatalities in 2005 = 38
tornado fatalities in 2006 = 67
tornado fatalities in 2007 = 81
tornado fatalities in 2008 = 126
tornado fatalities in 2009 = 22
tornado fatalities in 2010 = 45
tornado fatalities in 2011 = 553
tornado fatalities in 2012 = 69
tornado fatalities in 2013 = 55
tornado fatalities in 2014 = 47
tornado fatalities in 2015 = 36
tornado fatalities in 2016 = 18
tornado fatalities in 2017 = 35
tornado fatalities in 2018 = 10
tornado fatalities in 2019 = 42
tornado fatalities in 2020 = 76
tornado fatalities in 2021 = 104
tornado fatalities in 2022 = 23
tornado fatalities in 2023 = 86
tornado fatalities in 2024 = 52
Average month in 1950 5.208955223880597
Average month in 1951 6.211538461538462
Average month in 1952 4.770833333333333
Average month in 1953 5.67458432304038
Average month in 1954 5.6054545454545455
Average month in 1955 5.776649746192893
Average month in 1956 5.779761904761905
Average month in 1957 5.839160839160839
Average month in 1958 6.2695035460992905
Average month in 1959 5.836092715231788
Average month in 1960 5.711038961038961
Average month in 1961 5.764705882352941
Average month in 1962 5.665144596651446
Average month in 1963 5.695464362850972
Average month in 1964 5.919034090909091
Average month in 1965 5.800445930880714
Average month in 1966 6.2615384615384615
Average month in 1967 6.37108953613808
Average month in 1968 6.377473363774734
Average month in 1969 6.370065789473684
Average month in 1970 6.277182235834609
Average month in 1971 6.0517435320584925
Average month in 1972 5.887989203778678
Average month in 1973 6.1751361161524505
Average month in 1974 5.622222222222222
Average month in 1975 5.542981501632209
Average month in 1976 5.028776978417266
Average month in 1977 6.14906103286385
Average month in 1978 5.955640050697085
Average month in 1979 6.330994152046784
Average month in 1980 5.856812933025404
Average month in 1981 5.883631713554987
Average month in 1982 6.069723018147087
Average month in 1983 6.136559139784946
Average month in 1984 5.706725468577729
Average month in 1985 5.956140350877193
Average month in 1986 5.930718954248366
Average month in 1987 6.492378048780488
Average month in 1988 7.169515669515669
Average month in 1989 5.977803738317757
Average month in 1990 5.824360105913504
Average month in 1991 5.145759717314488
Average month in 1992 6.827293754818813
Average month in 1993 6.258532423208191
Average month in 1994 6.0711645101663585
Average month in 1995 6.092966855295069
Average month in 1996 6.215686274509804
Average month in 1997 5.954703832752613
Average month in 1998 5.728230337078652
Average month in 1999 4.985063480209111
Average month in 2000 5.933953488372093
Average month in 2001 6.74320987654321
Average month in 2002 7.183083511777302
Average month in 2003 5.760553129548763
Average month in 2004 6.896532746285085
Average month in 2005 6.77513855898654
Average month in 2006 5.906618313689936
Average month in 2007 5.502283105022831
Average month in 2008 5.308466548253405
Average month in 2009 5.698096885813149
Average month in 2010 6.373926619828259
Average month in 2011 5.046717918391485
Average month in 2012 5.0554371002132195
Average month in 2013 5.947019867549669
Average month in 2014 6.186230248306997
Average month in 2015 6.425658453695837
Average month in 2016 5.585040983606557
Average month in 2017 5.156162464985995
Average month in 2018 6.904973357015986
Average month in 2019 5.736980883322347
Average month in 2020 5.472273567467653
Average month in 2021 7.254185692541857
Average month in 2022 5.4776902887139105
Average month in 2023 5.140802422407267
Average month in 2024 6.029592406476828
There are some situations where looping through the group results is useful. However, for basic statistics, there is a much easier way to do this.
We will use the split-apply-combine functionality of pandas which, generally, does the following:
split: break the data up into subsets based on some shared value in a column (years, months, etc.)filtering the data for each unique value, example:
df[df.yr==year]apply: call a method for each subset to get results for subsets instead of the entire dataset (averages per year, counts per month, etc.)running a method on each subset for each unique value, example:
df[df.yr==year].mean()combine: take the results from each subset and recombine them into a new DataFrame for the users (averages for all years, counts for all months, etc.)combining the results of the method applied to each subset for each unique value, example:
pd.concat(results) #results is a list of results
The general method for accessing this functionality is included and handled for you in groupby.
This performs comparisons, loops through different subsets, calls functions, and merges the results for you so you do not have to worry about it. I strongly urge you to learn how to use this, as it will make your life much easier when working with large datasets. If you find yourself using a loop, running comparisons, or other tasks, as yourself if groupby could be used instead.
Examples:
We know that you can find statistics on columns:
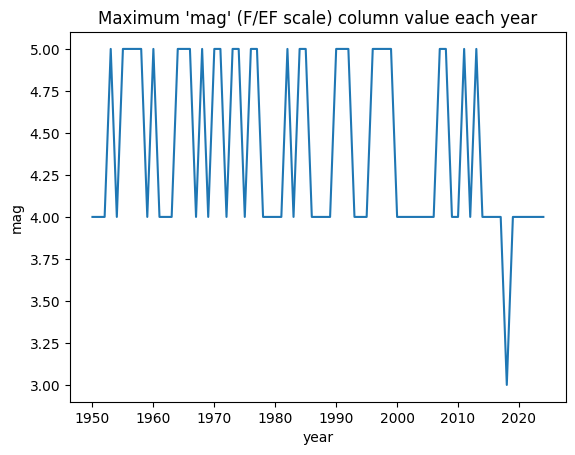
tor['mag'].max()np.int64(5)We saw in the previous code example one way we could go about getting the maximum magnitude per yearly subsets. But there is a better way!
Since groupby just gives you subsets / smaller DataFrames that all share a value for a particular column (e.g., all have the same ‘yr’), we can apply the statistics methods like we would on an individual column.
We will plot this visualize the results of the “chaining” of methods.
The interpretation of the results below is that some years have F/EF5, most years have at least an F/EF4, and one year only had a maximum rating of F/EF3.
import matplotlib.pyplot as plt

grouped_years = tor.groupby('yr')

max_year = grouped_years.max()

plt.plot(max_year.index, max_year['mag'])
plt.title("Maximum 'mag' (F/EF scale) column value each year")
plt.ylabel("mag")
plt.xlabel("year")
You can do this in one line!
max_year = tor.groupby('yr').max()

plt.plot(max_year.index, max_year['mag'])
plt.title("Maximum 'mag' (F/EF scale) column value each year")
plt.ylabel("mag")
plt.xlabel("year")
Here is the general pattern for groupby statistics:
dataframe_name.groupby('column_name').statistic_method_name()Common statistics:
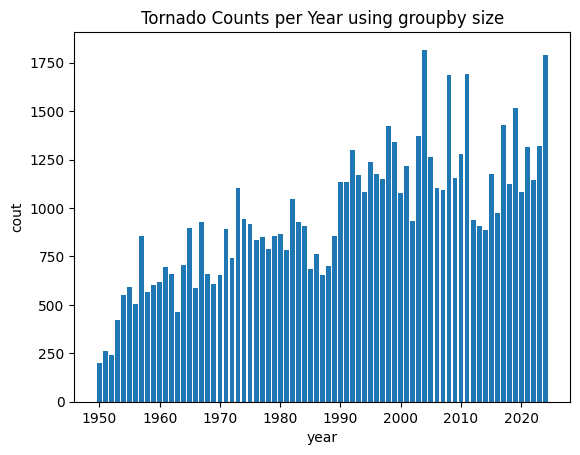
size: get the count of rows in each group
import matplotlib.pyplot as plt

yr_counts = tor.groupby('yr').size()

plt.bar(yr_counts.index, yr_counts)

plt.title("Tornado Counts per Year using groupby size")
plt.ylabel("cout")
plt.xlabel("year")
plt.show()
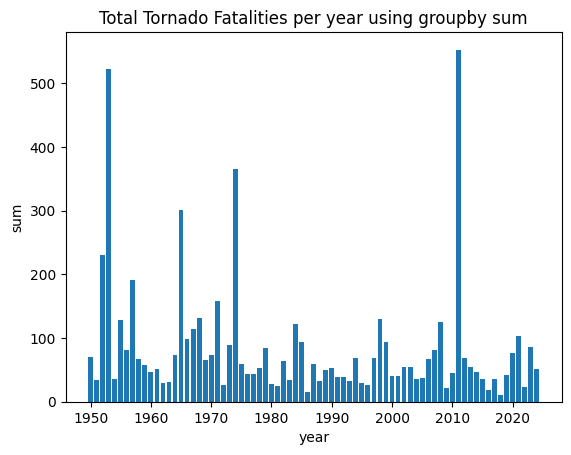
sum: get the sum column values for each group
yr_sums = tor.groupby('yr').sum()

plt.bar(yr_sums.index, yr_sums['fat'])

plt.title("Total Tornado Fatalities per year using groupby sum")
plt.ylabel("sum")
plt.xlabel("year")
plt.show()
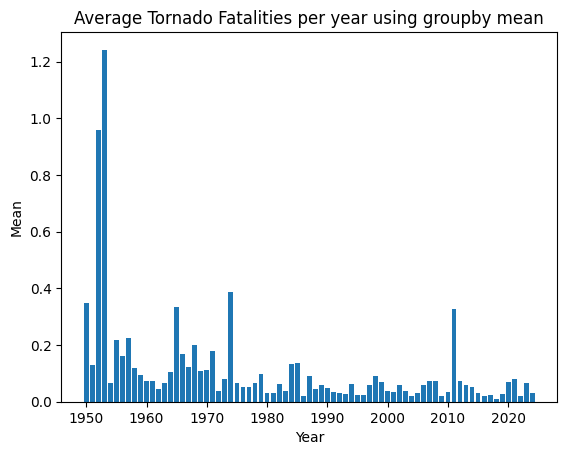
mean: get the mean column values for each group
You would want to subset the columns first to avoid getting an error.
In this code, we first get only the ‘yr’ and ‘fat’ columns in a subset before we run statistics:
yr_means = tor[['yr', 'fat']]
yr_means = yr_means.groupby('yr').mean()

plt.bar(yr_means.index, yr_means['fat'])

plt.title("Average Tornado Fatalities per year using groupby mean")
plt.ylabel("Mean")
plt.xlabel("Year")
plt.show()
Chapter 6.3.3 - Hurricane dataset (HURDAT2)
Get the dataset
!wget -nc https://raw.githubusercontent.com/ahaberlie/python_programming_geosciences/refs/heads/main/data/1950-2024_hurdat2.csvFile ‘1950-2024_hurdat2.csv’ already there; not retrieving.
Since this is a dataset many of us have never used before, we should read in the dataset and examine some basic information about it.
## index_col sets that column name to the index
hur = pd.read_csv("1950-2024_hurdat2.csv")

hur.columns
Index(['storm_id', 'storm_name', 'datetime', 'year', 'month', 'day', 'hour',
'record_id', 'status', 'lat', 'lon', 'max_wind_kt', 'min_slp_mb'],
dtype='object')hurFor this course, we will use a pre-processed, simplified version of this dataset from 1950 - 2024.
Unlike the tornado dataset, each storm can have many rows associated with it. For any one storm, observations, times, and positions are recorded. When you combine these for a storm, you call it the “storm track”. for example, we can follow the position from, say, the eastern Atlantic to Florida, with 6 hour updates along the track.
The column metadata are as follows:
storm_id: the unique identifier for each individual storm track within the dataset.
storm_name: Storm name (if available). This is not unique in the dataset. Some names are recycled many times from year to year. However, in each year, the name is only used once.
datetime: The date and time of the specific observation within the track. Usually every 6-hours along the track.
year, month, day, hour: The year, month, day, and hour of the specific observation within the track.
lat: The latitude at which the storm was centered at the observation time
lon: The longitude at which the storm was centered at the observation time
max_wind_kt: The maximum sustained winds at the observation time in knots
min_slp_mb: The minimum sea level pressure at the observation time in millibars
We can calculate per storm statistics by using a unique identifier.
Why will ‘storm_name’ work for one season, but not for many seasons?
Group by storm name and find the count of unique column values in each storm name’s subset and then sort in descending order by the ‘year’ column to get the top reused names in the dataset:
years = hur.groupby('storm_name').nunique()

years.sort_values(by='year', ascending=False)Find the maximum wind speed for each unique storm (by storm_id) and sort in descending order by ‘max_wind_kt’ to get the top wind speeds for each storm. First, subset the statistics only for storm_id, year, storm_name and max_wind_kts:
max_values = hur[['max_wind_kt', 'storm_name', 'year', 'storm_id']]
max_values = max_values.groupby('storm_id').max()

max_values.sort_values(by='max_wind_kt', ascending=False)Try it yourself
Group the hurricane data by “storm_id” and print the name of each group
Create a new column named ‘SS Scale’ and figure out a way to use the max_wind_kt to calculate categories from this: https://en.wikipedia.org/wiki/Saffir–Simpson_scale
Group the hurricane data by month (df.month) and count the number of unique storms.
Plot the “tracks” of storms that reached at least category 1 in your ‘SS Scale’ column.
import matplotlib.pyplot as plt