5 total points
Directions
Due: 12/7/2025 @ 11:59 p.m.
Change the name of your notebook to EX12_FirstLast.ipynb, where First is your first name and Last is your last name.
For each of the following prompts, write or modify Python code that fulfills the requirements.
All problems are worth 0.5 points unless otherwise specified.
Problem 1
Add a title to the following plot with the text “Problem 1”
import matplotlib.pyplot as plt

x = 1
y = 1

plt.plot(x, y, "k*")
Problem 2
Add a label to the y axis with the text “unit y”
Add a label to the x axis with the text “unit x”
import matplotlib.pyplot as plt

x = 1
y = 1

plt.plot(x, y, "r*")
Problem 3
Create a line graph with the following x and y data.
import matplotlib.pyplot as plt

x = [1, 2, 3, 4, 5]
y = [1, 2, 3, 4, 5]
Problem 4
Create a bar graph with the following x and y data
import matplotlib.pyplot as plt

x = [1, 2, 3, 4, 5]
y = [10, 20, 30, 40, 50]
Problem 5
Create a scatterplot with the following x and y data
import matplotlib.pyplot as plt

x = [15, 25, 35, 45, 55]
y = [10, 20, 30, 40, 50]
Problem 6
Change the following line graph to display a horizontal line instead of a vertical line:
import matplotlib.pyplot as plt

x = [10, 10, 10, 10, 10]
y = [10, 20, 30, 40, 50]

plt.plot(x, y)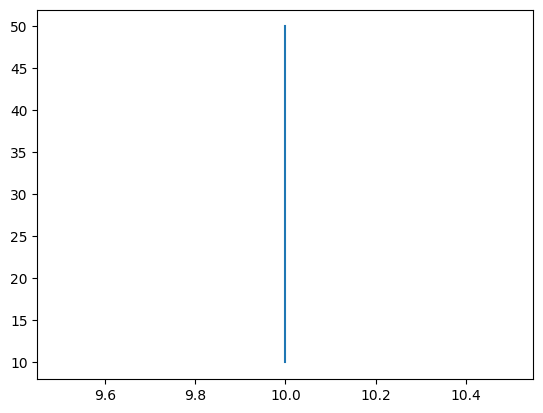
Problem 7
Change the following line graph to display a diagonal line instead of a vertical line:
import matplotlib.pyplot as plt

x = [10, 10, 10, 10, 10]
y = [10, 20, 30, 40, 50]

plt.plot(x, y)
Problem 8
Draw a triangle using the plot method.
import matplotlib.pyplot as plt

x = [1, 1]
y = [1, 2]

plt.plot(x, y)
Problem 9
Draw a square using the plot method.
import matplotlib.pyplot as plt

x = [1, 1]
y = [1, 2]

plt.plot(x, y)
Problem 10
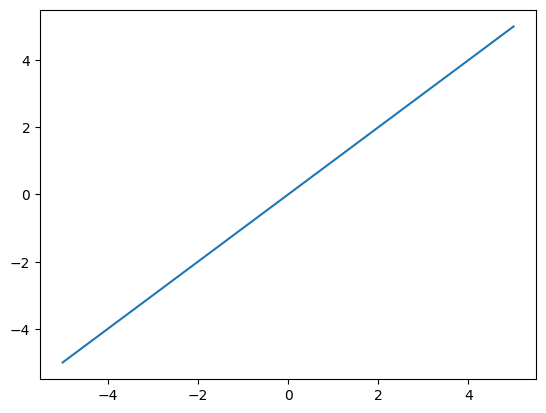
Modify the following code using numpy to draw using plot and the given x values:
import numpy as np

# do not change
x = [-5, -4, -3, -2, -1, 0, 1, 2, 3, 4, 5]

# change
y = x

# do not change
plt.plot(x, y)